Type
 

dataset

282 record(s)
 
Type of resources
Available actions
Topics
Keywords
Contact for the resource
Provided by
Years
Formats
Representation types
Update frequencies
status
Scale
Resolution
From 1 - 10 / 282
  • Categories  

    This dataset is the definitive set of locality boundaries for the state of Victoria as defined by Local Government and registered by the Registrar of Geographic Names. The boundaries are aligned to Vicmap Property. This dataset is part of the Vicmap Admin dataset series.

  • Categories      

    Major hydrological basins and their sub-basins. This dataset divides the African continent according to its hydrological characteristics. The dataset consists of the following information:- numerical code and name of the major basin (MAJ_BAS and MAJ_NAME); - area of the major basin in square km (MAJ_AREA); - numerical code and name of the sub-basin (SUB_BAS and SUB_NAME); - area of the sub-basin in square km (SUB_AREA); - numerical code of the sub-basin towards which the sub-basin flows (TO_SUBBAS) (the codes -888 and -999 have been assigned respectively to internal sub-basins and to sub-basins draining into the sea)

  • Categories    

    Physiographic maps for the CIS and Baltic States (CIS_BS), Mongolia, China and Taiwan Province of China. Between the three regions (China, Mongolia, and CIS_BS countries) DCW boundaries were introduced. There are no DCW boundaries between Russian Federation and the rest of the new countries of the CIS_BS. The original physiographic map of China includes the Chinese border between India and China, which extends beyond the Indian border line, and the South China Sea islands (no physiographic information is present for islands in the South China Sea). The use of these country boundaries does not imply the expression of any opinion whatsoever on the part of FAO concerning the legal or constitutional states of any country, territory, or sea area, or concerning delimitation of frontiers. The Maps visualize the items LANDF, HYPSO, SLOPE that correspond to Landform, Hypsometry and Slope.

  • Categories  

    A Agência Nacional de Águas, com o objetivo de conhecer e divulgar os dados sobre o volume de água disponível nos açudes por ela gerenciados no Semiárido, realizou trabalhos de batimetria de maneira a gerar planilhas atualizadas com as Curvas Cota x Área x Volume de tais açudes. Aqui podem ser baixados os dados geográficos no formato geodatabase (contendo áreas de drenagem, polígono do barramento, limites do reservatório, pontos cotados utilizados no processamento, curvas de nível e os modelos digitais de elevação do reservatório - tanto no sistema de cotas local como no SGB), Relatório Final do Levantamento Batimétrico e Planilhas com Curvas Cota x Área x Volume Atualizadas (tanto no sistema de cotas local como no SGB) de cada um dos açudes analisados.

  • Categories  

    A Resolução Conjunta ANA/ANEEL nº 03/2010 estabelece que as Usinas Hidrelétricas despachadas centralizadamente pelo Operador Nacional do Sistema Elétrico (ONS) ao completar 10 anos em operação comercial, devem realizar a avaliação do assoreamento dos seus reservatórios com a atualização das tabelas Cota x Área x Volume (CAV). A seguir estão disponíveis todos os dados das Usinas Hidrelétricas cujos Relatórios foram analisados pela ANA e considerados coerentes, com os seguintes arquivos: - Dados Geográficos no formato geodatabase (limites do reservatório, seções de controle, curvas de nível e o modelo digital de elevação do reservatório); - Relatório Final do Levantamento Batimétrico; - Planilha com as Tabelas Cota x Área x Volume Atualizadas. No link https://link.ana.gov.br/snirhbatimetria encontram-se os mapas das Usinas para visualização.

  • Categories  

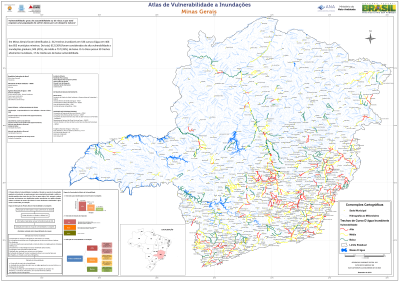
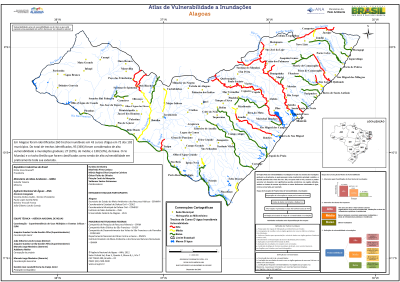
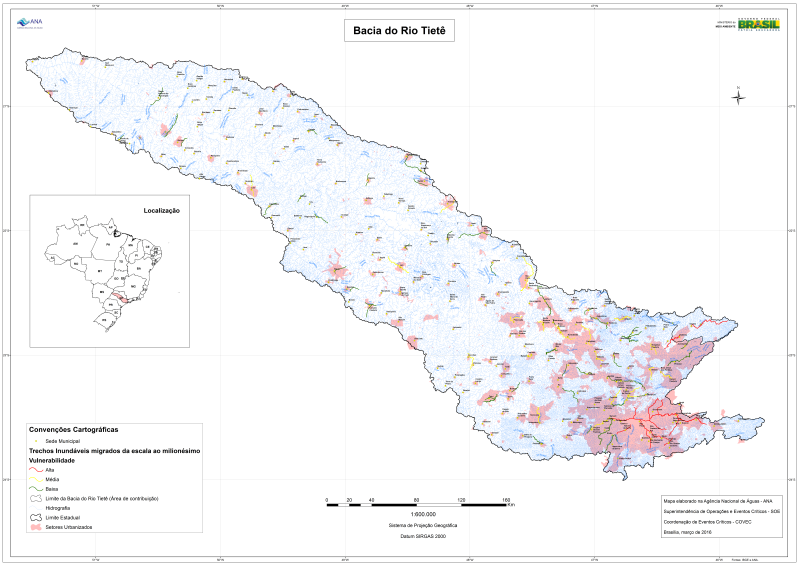
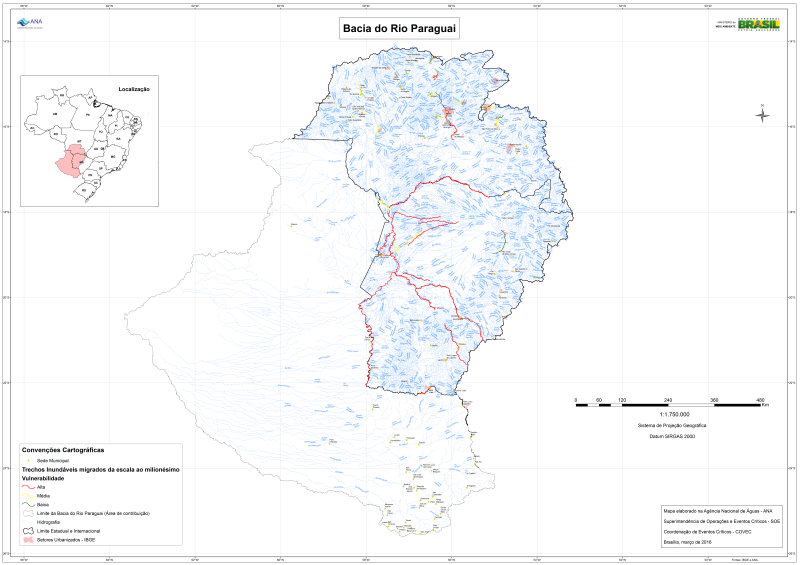
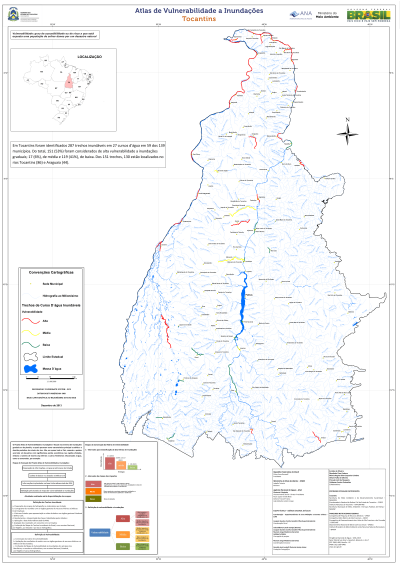
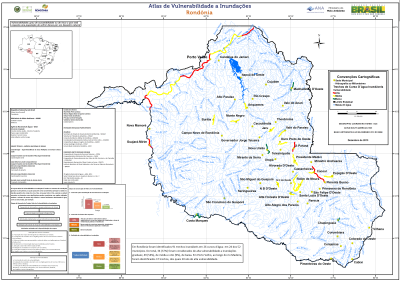
    Trechos de curso d'água inundáveis contendo os atributos de ottocodificação, frequência de ocorrência, grau de impacto e vulnerabilidade a inundações graduais.

  • Categories  

    Comitês de Bacias Hidrográficas Interestaduais classificados segundo a situação da Cobrança pelo Uso dos Recursos Hídricos.

  • Categories  

    Comitês de Bacias Hidrográficas Estaduais classificados segundo a situação da Cobrança pelo Uso dos Recursos Hídricos.

  • Categories  

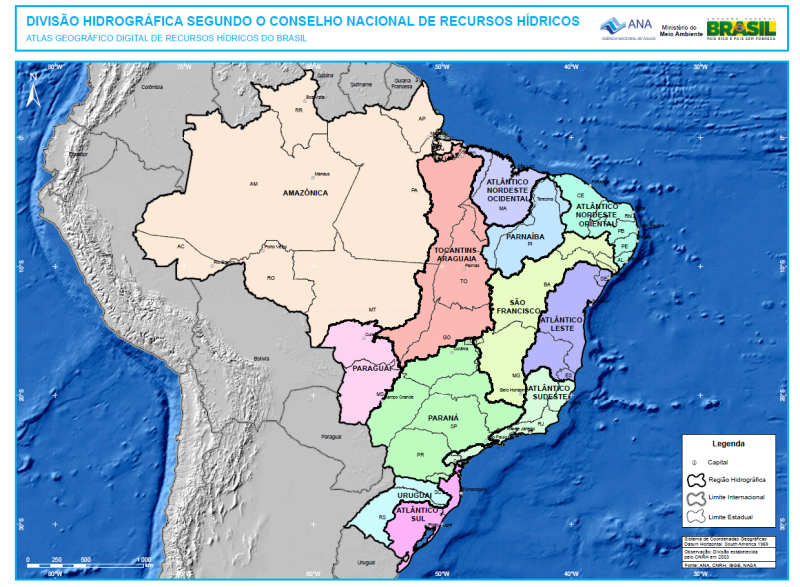
    Evapotranspiration (ET) connects the land to the atmosphere, linking water, energy, and carbon cycles. ET is an essential climate variable with a fundamental importance, and accurate assessments of the spatiotemporal trends and variability in ET are needed from regional to continental scales. This study compared eight global actual ET datasets (ETgl) and the average actual ET ensemble (ETens) based on remote sensing, climate reanalysis, land-surface, and biophysical models to ET computed from basin-scale water balance (ETwb) in South America on monthly time scale. The 50 small-to-large basins covered major rivers and different biomes and climate types. We also examined the magnitude, seasonality, and interannual variability of ET, comparing ETgl and ETens with ETwb. Global ET datasets were evaluated between 2003 and 2014 from the following datasets: Breathing Earth System Simulator (BESS), ECMWF Reanalysis 5 (ERA5), Global Land Data Assimilation System (GLDAS), Global Land Evaporation Amsterdam Model (GLEAM), MOD16, Penman–Monteith–Leuning (PML), Operational Simplified Surface Energy Balance (SSEBop) and Terra Climate. By using ETwb as a basis for comparison, correlation coefficients ranged from 0.45 (SSEBop) to 0.60 (ETens), and RMSE ranged from 35.6 (ETens) to 40.5 mm·month−1 (MOD16). Overall, ETgl estimates ranged from 0 to 150 mm·month−1 in most basins in South America, while ETwb estimates showed maximum rates up to 250 mm·month−1. ETgl varied by hydroclimatic regions: (i) basins located in humid climates with low seasonality in precipitation, including the Amazon, Uruguay, and South Atlantic basins, yielded weak correlation coefficients between monthly ETgl and ETwb, and (ii) tropical and semiarid basins (areas where precipitation demonstrates a strong seasonality, as in the São Francisco, Northeast Atlantic, Paraná/Paraguay, and Tocantins basins) yielded moderate-to-strong correlation coefficients. An assessment of the interannual variability demonstrated a disagreement between ETgl and ETwb in the humid tropics (in the Amazon), with ETgl showing a wide range of interannual variability. However, in tropical, subtropical, and semiarid climates, including the Tocantins, São Francisco, Paraná, Paraguay, Uruguay, and Atlantic basins (Northeast, East, and South), we found a stronger agreement between ETgl and ETwb for interannual variability. Assessing ET datasets enables the understanding of land–atmosphere exchanges in South America, to improvement of ET estimation and monitoring for water management.

  • Categories  

    Trechos de curso d'água inundáveis com os atributos de ottocodificação, frequência de ocorrência, grau de impacto e vulnerabilidade a inundações graduais.